Repeatscape Help
Several screenshots of the Repeatscape might help you to learn how to use the browser interface at a glance.
Supported Web Browsers
- Firefox3
- Safari
- Internet Explorer 7 (We have not yet tested the Repeatscape on IE8 )
We strongly recommend you to use Firefox3 or Safari since they are quite faster than IE, especially for the sites using AJAX technologies, like Repeatscape.
Available Sequence Names
In order to see the Repeatscape data from the browser, you have to input one of the following values in the target text box.
- human
- chr1, chr2, ..., chr22, chrX, chrY
- chr1_random, chr2_random, ..., chrY_random
- mouse
- chr1, ..., chr19, chrM, chrX, chrY
- chr1_random, ..., chrY_random
- chrUn_random
- drosophila
- 2L, 2R, 3L, 3R, 4, U, X, Y
- 2LHet, 2RHet, 3RHet, Uextra, XHet, YHet
- dmel_mitochondrion_genome
- medaka
- scaffold1, ..., scaffold8134
Track Frame Manipulation
Track Resizing
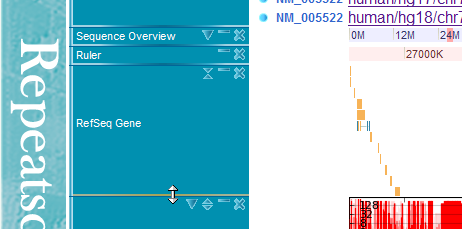
You can resize the track height by dragging the bottom border of each track.

By clicking adjust height botton, you can fix the height of tracks. If the track content exceeds the track frame height, a scroll bar will appear. By clicking the adjust height button again, the track height will change dynamically according to the actual height of the track content (This auto-adjust mode is the deafult behaviour).

Drag & Drop
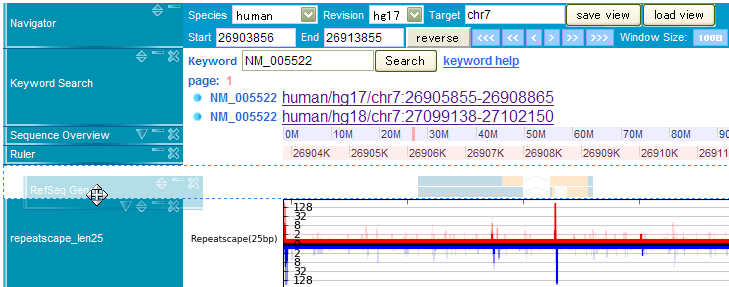
You can also change the track order by dragging around track names and dropping the track anywhere you want.

Repeatscape Tracks
Navigator

This track provides information about displaying genomic region. You can change genomic location by manipulating this track. Some of the values can be changed using drop down menu, where others needed to be input into the parameter boxes (like above image) inside the main window. The details about this method are as follows,
- Species This drop down menu can be used to select species name to be viewed.
- Revision This drop down is provided to select the genome version of the species select in Species section. At present, only drosophila genome version R5.3 is only possible to be selected.
- Target Input the chromosome (or scaffold) name e.g., chr2 to display.
- Start Input the start position of the chromosome to display.
- End Input the end point of the chromosome to display. If the start point is greater than the ending point, the sequence is displayed inversely.
- Reverse Clicking on reverse button at the track will arrange the displayed genomic region in reverse complementary orientation.
- Move button The arrow buttons arranged on this track can be used to shift the displayed genome location to left or right direction by clicking on desired arrow. It will relieve users who are clumsy at keyboard input.
- Window Size Window option provides user to resize the present displayed windows by remaining the center point fixed.
Save view
To save the present displaying tracks and their parameter, please click on save view button. All the displayed tracks information will be saved as XML file.
Load view
To display the saved view as XML file, please write the proper path and file name here. This option provides function to see the previously saved window of Repeatscape.
Keyword

In the keyword search track, you can find locus of RefSeq genes on the genome sequence. For example, when you enter a keyword, say NM_005522, the search result will be as the above picture. By clicking one of the search results, you can jump to the displayed location on the genome browser.
Notice!!
Because of some program bugs, RefSeq genes may not appear at the first click on a keyword search result. In this case, click the link again, and you will see RefSeq genes if they exist in the current genome location.
Sequence Overview

This track shows the location of presently displayed region on the chromosome. In the above image, for instance, the pink-colored box shows the displaying region around 4,383,333-4,983,333. This window size can be manipulated by using configure button available on left side blue rectangle of the track.
The right-most value (max index on genome) of the sequence overview track changes according to the currently displayed choromosome (or scaffold) length.
Ruler

The ruler track shows the base position number of the present displayed content with respect to the total sequence. For example, in the above image, the sequence region from 419,700 to 420,700 is displayed. Any genomic region can be selected by dragging any region of the ruler track. The cross button on the left side blue rectangle can be used to manipulate the track.
You can select any specific region by clicking twice (for start and end positions) over the ruler track (or sequence overview track) to select a range on the genome sequence.

Repeatscape

This track displays specificity of every short region (25bp and 26bp) in the genome. In details, every 26bp short sequence starting from any point of genome is taken and aligned to the whole genome allowing at most two mismatches to count its occurrence in the genome.
Three color gradations indicate the numbers of occurrences of each 25-nt (or 25-nt) region in the whole genome, allowing no, one, and two mismatches in alignments, respectively. The darkest color indicates the frequencies of no mismatches, while the lightest color denotes the frequencies of two mismatches.
The red color is for plus strand specificity where the blue is for minus strand. Log scale is used to express vertical bar in this track.
RefSeq Gene Track

The RefSeq gene track shows RefSeq genes on the currently displayed genome location.

The red colored genes are plus strand, and blue colored ones are minus strands. Light colored regions are coding sequences (CDS). Exon regions that involve introns are connected through lines.

By clicking the gene region, you can see the gene name and link to the NCBI's RefSeq database site.